
Once you have input your emissions data into the emissions inventory, part of modelling your end year scenario is looking at your energy supply and demand.
In the “Energy Model” tab in the pathways section, you first get an overview of the emission trajectory of your electricity production until your goal year as per your values set under “I.4 Energy industries” and its sub-category “Electricity only generation” (Fig. 1).
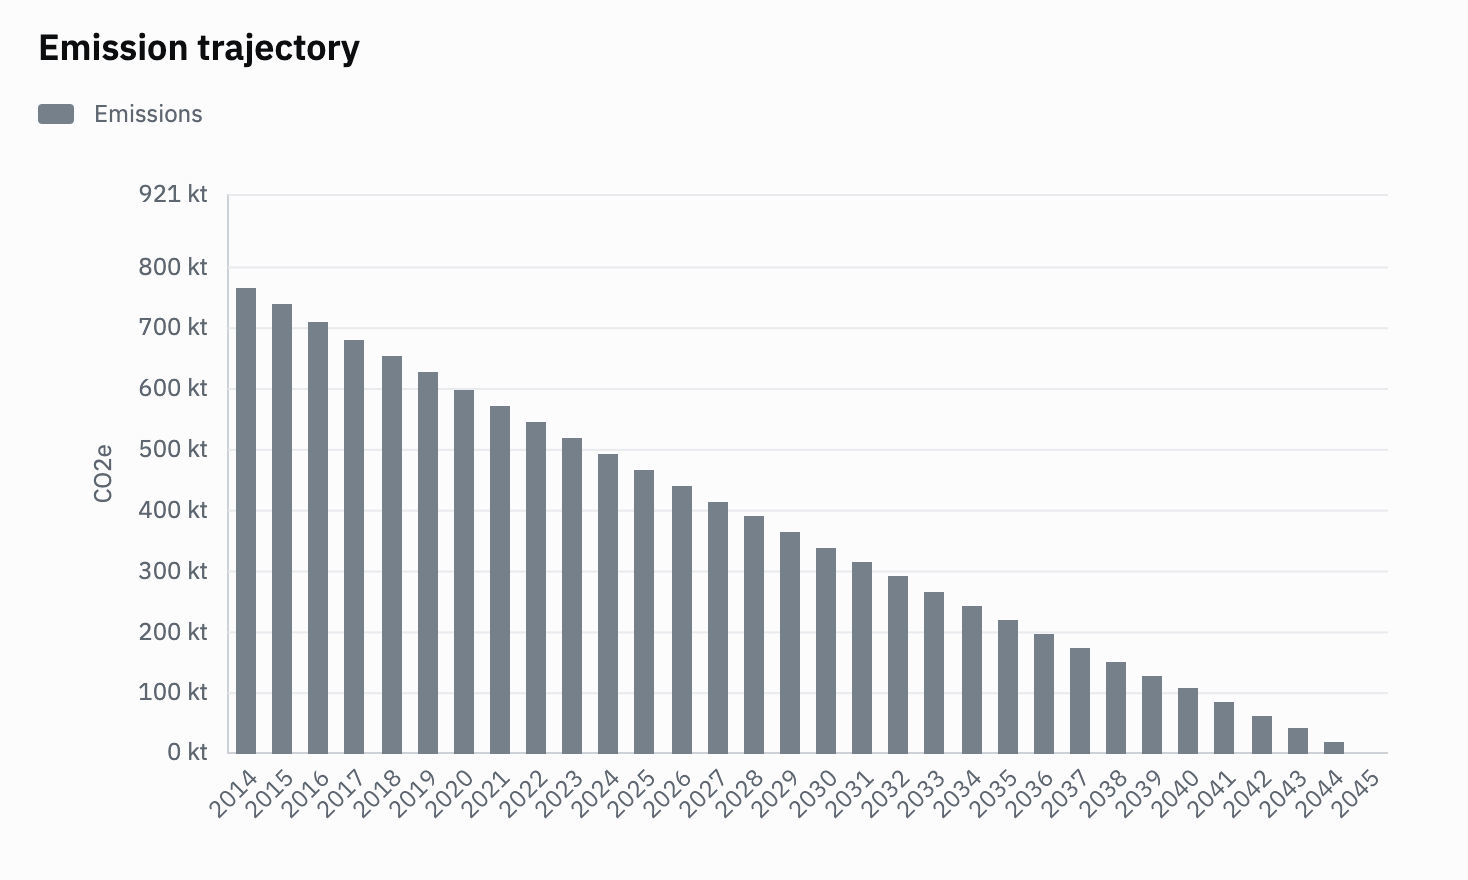
Fig. 1
Right below, you get an overview of the total amount of electricity produced in your city and target year, its distribution by source, and the total amount of required electricity based on the shifts you're planning through Transition elements.
For example, if you shift more and more vehicle kilometers from fossil-fueled cars to electric cars or heat more homes with heat pumps instead of oil heaters, you will see an increase in the required electricity which you will then have to compensate by either producing more electricity locally or importing more electricity from the grid. It essentially gives you an overview of your city’s electricity demand and supply in your set end year and allows you to dynamically plan how to produce the required future electricity.

Fig. 2
Integrating the energy model into your pathways section makes your climate action plan in ClimateOS a more accurate model of reality where we are clearly separating electricity consumption, e.g., driving EVs and using heat pumps, from production, e.g., wind parks or PV, while keeping an overview of both for them to match in our city.
The same logic applies to the district heat part of the energy model. Right below the "Electricity" in the tree menu on the left, you can find district heat. The graphs are built in the same way as for the electricity production. The numbers you'll find here refer to the CHP parameters as well as the parameters for heat/cold generation under the I.4 category in the inventory.
By using the energy model, you understand how much energy (electricity and district heat) is required in your set end year based on your pathway to net-zero, can plan how you want to meet it, and see directly the carbon impact of your chosen energy mix. Through this, you can make better-informed decisions on what transitions to perform, how they impact your emissions and ultimately create a better and more realistic plan for your city.
In the targets for your target year, you see a dotted line indicating the required energy based on the Transition elements you selected in your pathways and their respective objectives that require electricity/district heat as a resource. It can be higher than the energy produced, depending on the Transition elements we have selected and the targets we have set for them. If that’s the case, you can activate the bar chart by clicking on “Edit”. Now you can move the levers for the different sources and plan dynamically how you plan to fill the gap between energy demand and supply. The energy mix you create also affects your total electricity /district heat emission factor. For example, if you increase more renewable energies like PV or hydro power, this will improve your average emission factor for your mix.
For the imported grid/district heat, you can set an end year emission factor, when you click on the respective entry in the tree menu on the left.

The emission factors for the different sources can be edited in the city inventory.
FAQs:
How do I change over to the new energy model?
- Move all operations not accounted for anywhere else in the inventory
from: I.4 Energy industries / Electricity Consumption / Other grid electricity consumption
to: I.6 Non-specified stationary energy / Electricity use, non-specified sources - Move all operations not accounted for anywhere else in the inventory
from: I.4 Energy industries / Electricity only generation / TO BE DELETED Domestic Solar PV
to: I.4 Energy industries / Electricity only generation / Solar rooftops - If applicable: Move all operations from the oil/gas/coal fired power plants prefixed "TO BE DELETED"
to: I.4 Energy industries / Electricity only generation to their corresponding CCCs in the same view. - Specify the Electricity sources from which the electricity originates both imported and locally produced. This is done under I.4 Energy industries / Electricity only generation.
- Specify the emission factor for the imported grid in the inventory: Emission factors / Secondary energy / Electricity imported grid
- Balance how to produce electricity in the resource balancing exercise shown in Fig. 2 (above)
-
Remove the following Transition elements from the Transition hierarchy:
-
Improved Grid Electricity
-
PVs on roof-tops
-
Wind power
-
Will I be able to choose which energy sources will show in my energy model?
Since not all energy sources apply to all cities, i.e., coal-fired power plants, you will soon be able to select and de-select energy sources relevant to your city.
Will the energy model be part of my public dashboard?
If your dashboard contains Transition Elements that consume electricity/district heat, then the energy model will affect these. The energy model diagrams will not be shown in the public dashboard.