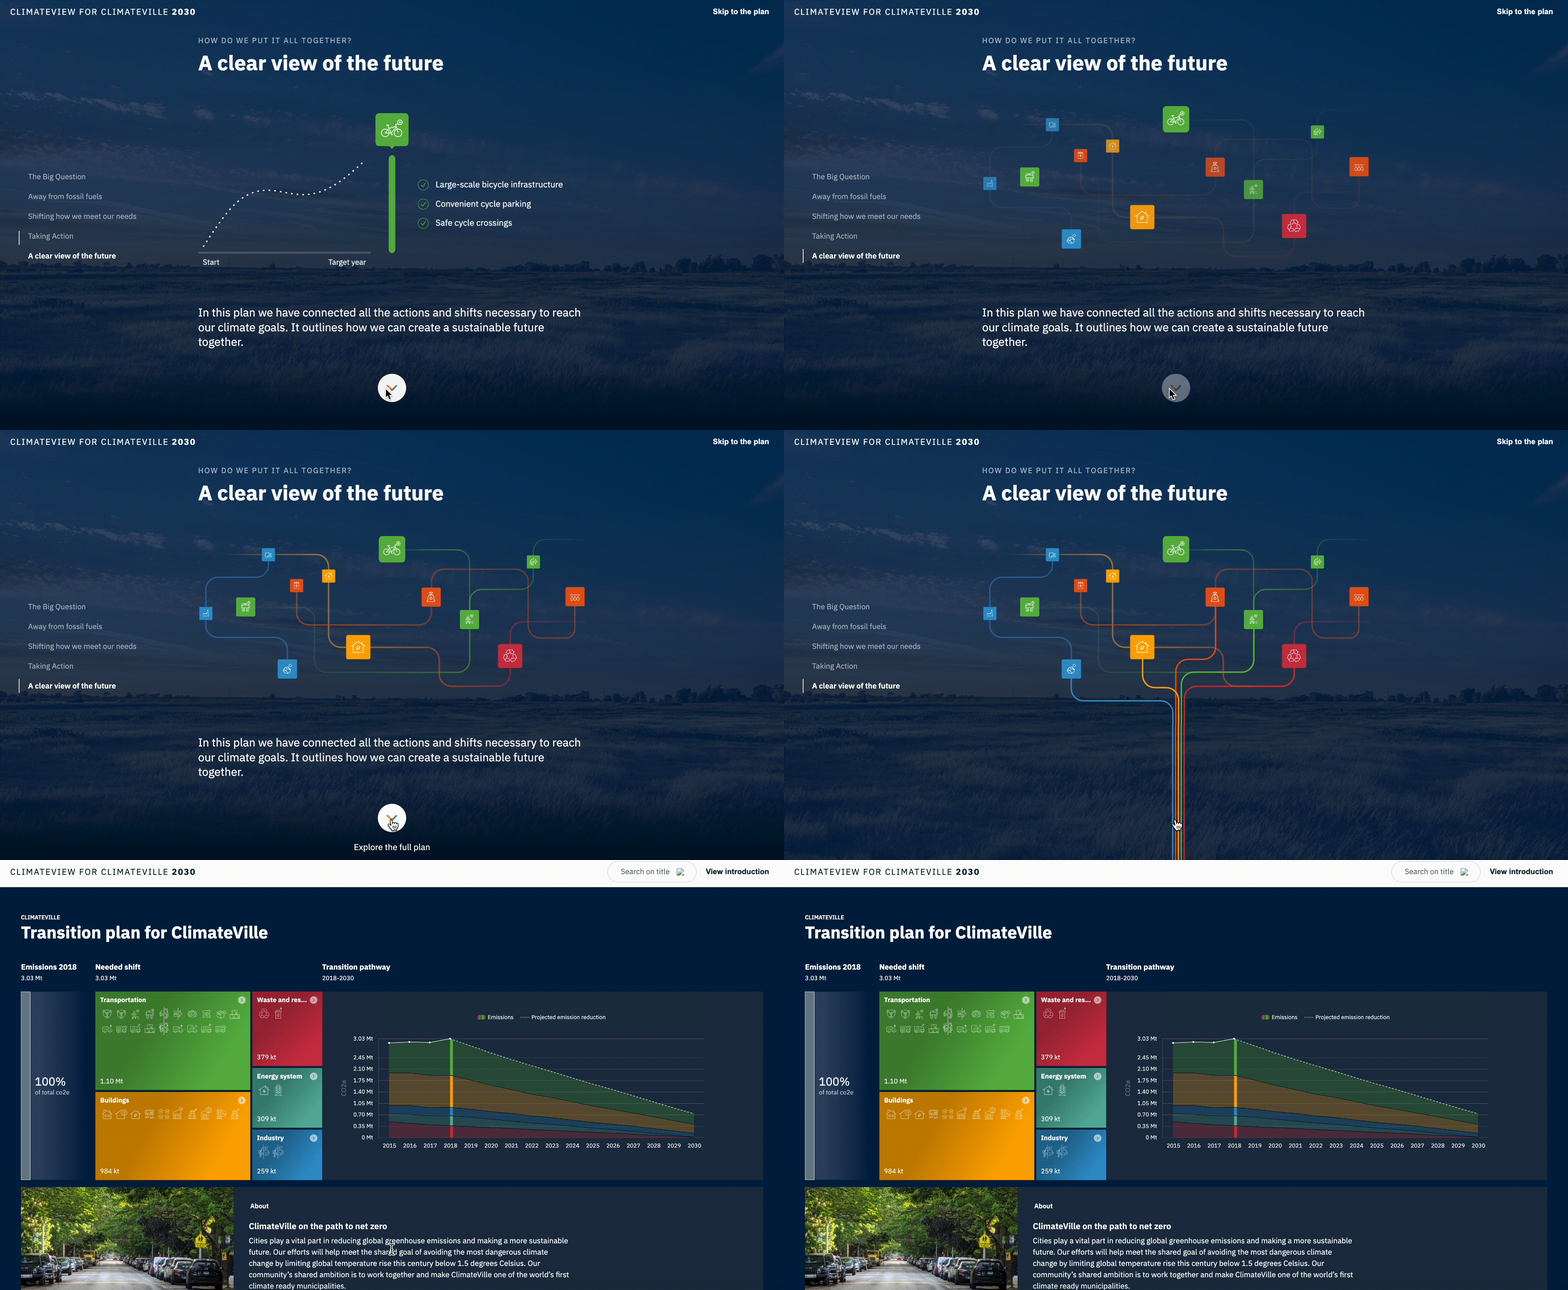
Before diving into the dashboard and its different sections, your citizens and other stakeholders will get an introduction to your climate action story. This part of your published dashboard sets the stage for how you as a city are approaching this challenge and connects it with the underlying model of ClimateOS: Continuing to meet the city’s economic and social needs while shifting the emissions associated to them to low-carbon alternatives.
This section emphasizes that bringing your city’s greenhouse gas emissions to zero is a major undertaking, needing the support of your city’s residents and other stakeholders. Using the ClimateOS platform lets you embed your planned transition into the bigger picture, making it easier for everyone to understand how your transition is built and how your city is planning to reach net-zero without negatively impacting your city’s socio-economic activities and/or services.
The climate action story leading up to your dashboard explains the methodology of how climate action plans are built. It addresses residents' most frequently asked questions. As a first step, it takes a look at the current situation and where it leads to if nothing changes (see below the example for getting to work) to convey the urgent need for change.
Please note: For the moment, these sections are not customizable and serve the purpose of exemplifying the work you have done to get to your Climate Action Plan. This is why there are no concrete figures in these sketches.
Once your citizens and stakeholders understand the need for change, they are introduced to the methodology behind the shifts in activity you will be implementing (those are your Transition elements).
The Taking Action section of your climate action story is where the thinking behind bridging the gap between the status quo and your climate action goal is explained. Your audience will get a grasp of how your Climate Action Plan is structured, and that concrete, tangible actions form a big part of it.
The final part of your climate action story is the dashboard. It’s where all of the above information comes together in one completely digital, interactive, and action-oriented climate action plan.

