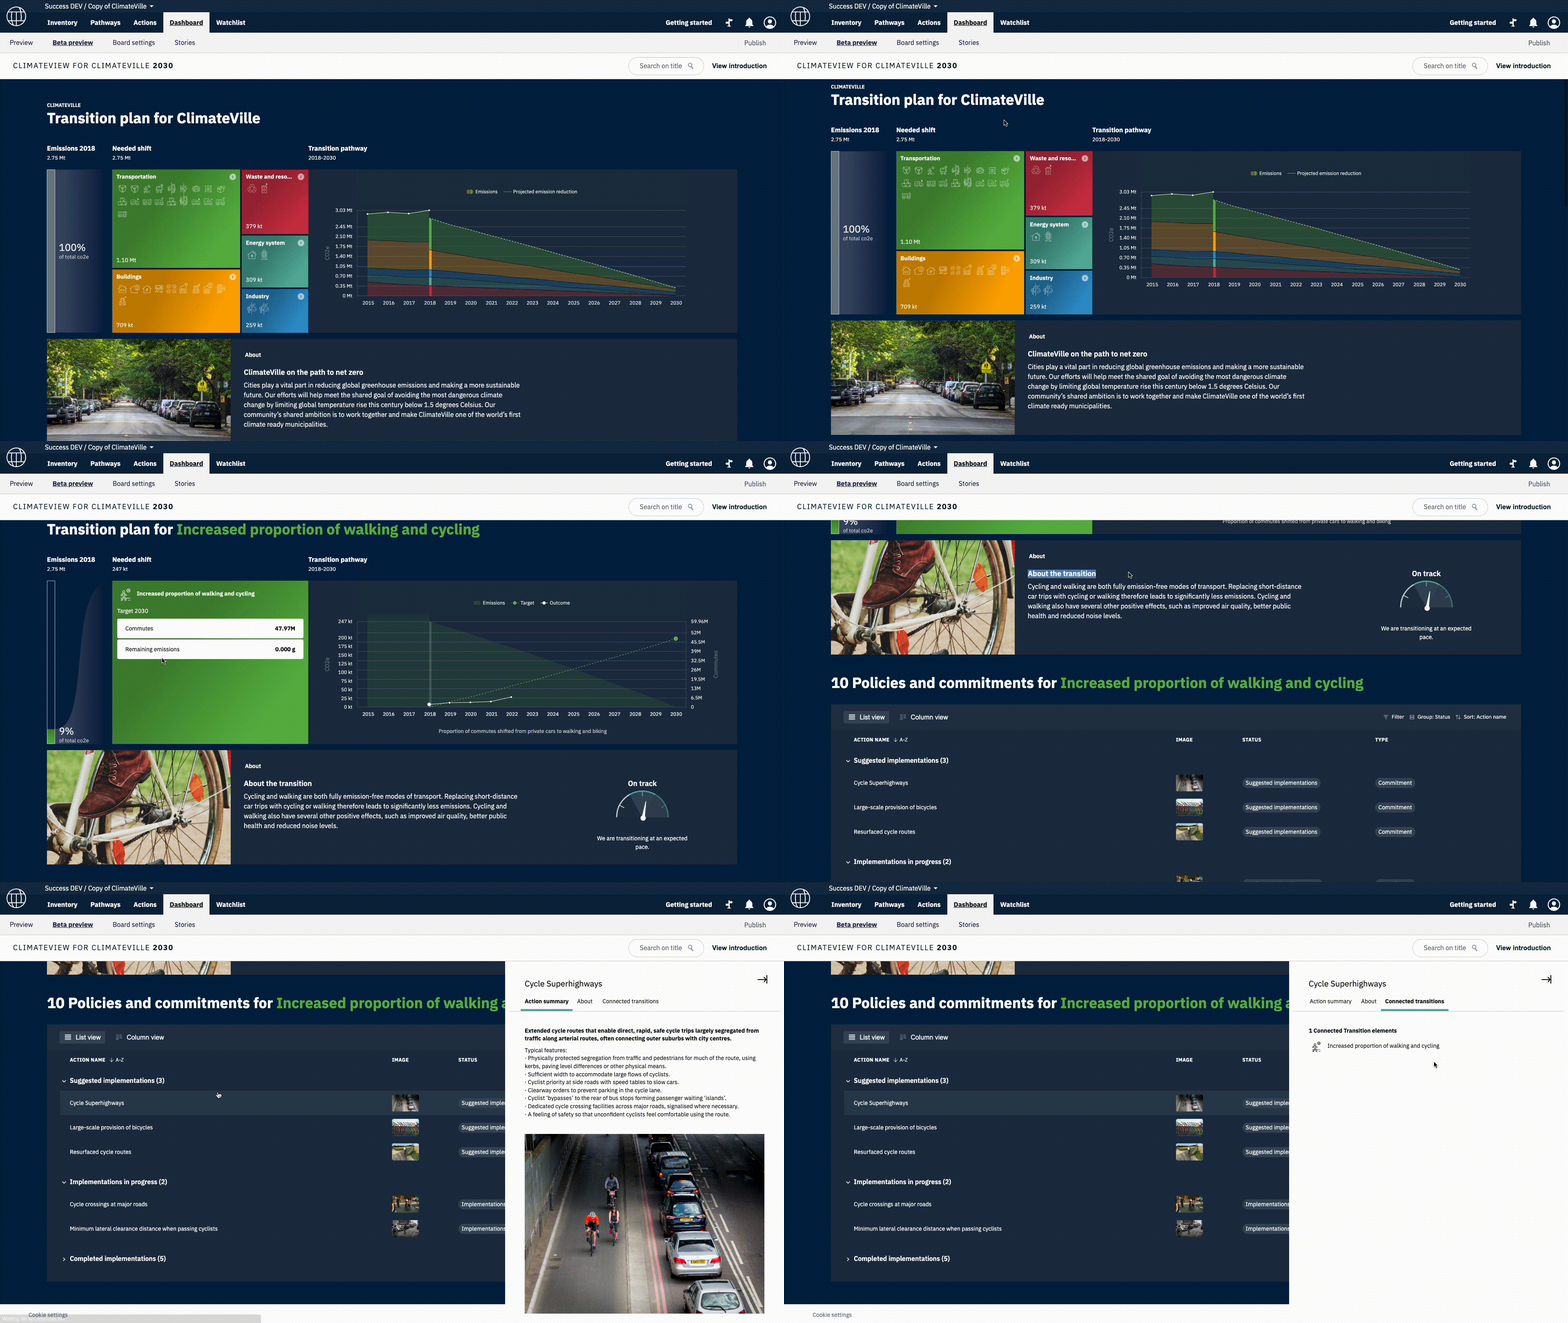
Following your city’s climate action story is the actual dashboard - the front cover for your city’s climate transition.
It consists of several elements:
A. Your city’s Transition Plan
B. Your city’s narrative for the transition
C. Your city’s policies and commitments to facilitate the transition
D. Detailed information about your individual Transition elements

A. Your city’s Transition Plan
The Transition Plan gives you a clear overview of:
- Your city’s historical emissions (if applicable) before your transition start year
- Your city’s current emissions broken down by sector
- Your city’s transition pathway to reach net zero, outlining which areas of activity are contributing to the overall transition and by how much
- If your Transition elements (shifts in activity) are delivering on the promise to reach net-zero by your target year
The dashboard presents information about your transition in a comprehensive and systematic way, based on the work that you did in the City inventory and the emission reduction forecast by sector based on your selected Transition elements. Anyone viewing your dashboard will get a clear sense of how the shifts in mechanism to fulfill your city’s needs will lead to emission reductions by sector. This is being complemented by displaying the actions to facilitate your transition. The dashboard also shows whether you are on track to achieve your city’s goals and helps any viewer appreciate the depth and scale of your transition.
Every click through the dashboard will give the viewer the information needed to understand and interpret the transition at hand, meaning a screenshot of any part of this visualization can be embedded wherever needed with minimal explanation.
Please Note: We focus on how you can use your dashboard as a communication tool in this article.
The amount of detail shown in your city's dashboard depends on the amount of information you put into ClimateOS.
In short: The Transition Plan provides an activity-based perspective on your city's emissions by sector and your reduction trajectory based on the targets you set for each Transition Element.
B. Your city’s narrative for the transition
Getting buy-in from your citizens and other stakeholders is key in making your climate action plan become a reality. This is why the dashboard includes a dedicated section for your city’s narrative around climate action. It is a space for you to frame the plan in a coherent way, to share the thought process behind your transition to net-zero and how you plan to get there. It is also an opportunity for you to outline how your citizens and stakeholders can engage in the transition process. This is an important step to build long-term support for your transition. You can adjust this section for each sector and sub-sector individually, painting a systematic picture across all city sectors.
C. Your city’s policies and commitments facilitating the transition
Which actions you are taking to make your transition become a reality and if you are currently on track.
The final part of your city’s dashboard gives the audience a sense of how exactly you will deliver your emissions reduction plans. It provides an overview of the policies and commitments you have or are setting in place. These could be solely led by the city, in partnership with others, or in collaboration with the national government.
This section is essential to creating engagement and credibility for your plan as residents will not perceive the transition as an abstract concept, but as a manageable task broken down into actionable steps.
D. Detailed information about your individual Transition elements
For each Transition element, you can add details to provide better understanding and achieve further buy-in from stakeholders. It also shows if your city is currently “on track” / “slow” / “no transition pace set” for each of them.
This functionality helps you create a sense of accountability and transparency about the progress of your plan.
