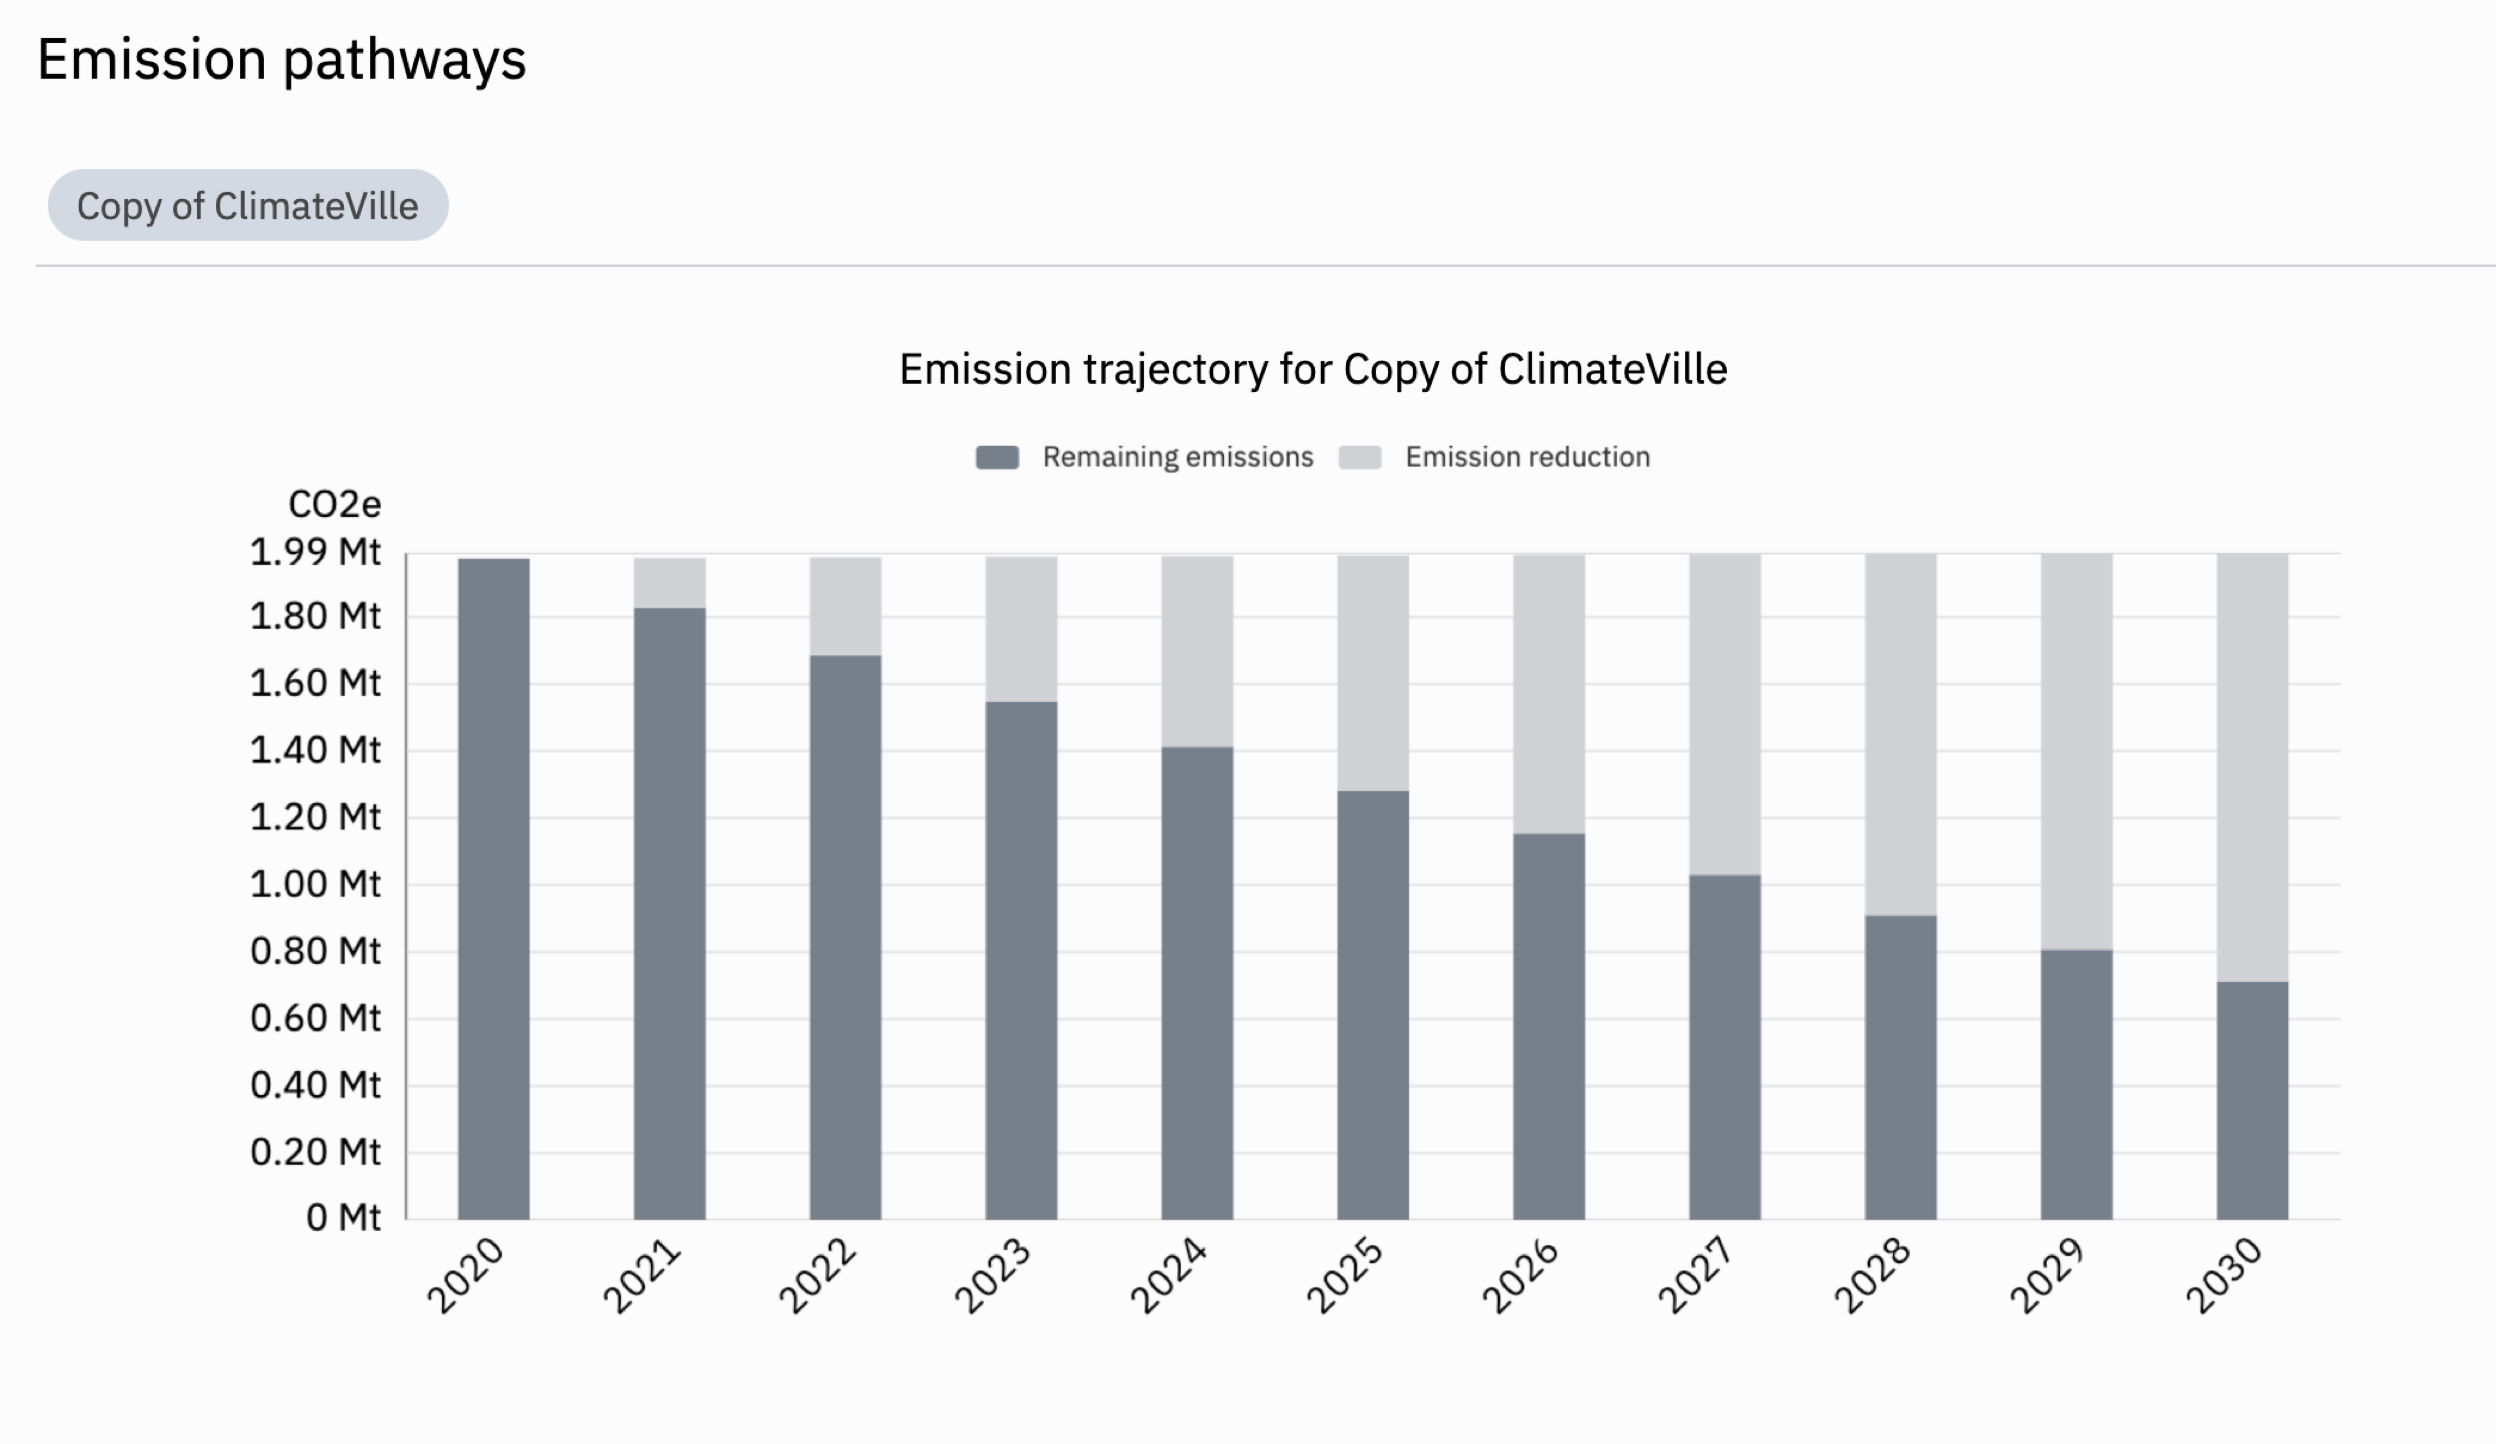
The Transition pathways feature, found in the navigation bar under Pathways, enables you to look at and assemble all emission trajectories for each sector, sub-sector, Transition element grouping and Transition elements you defined and selected in your Transition hierarchy. This gives you an even more granular way to look at your trajectories.
This feature helps you with the framing of your transition: establishing the rate of change of emissions reduction needed in total, and in defined areas which you can use to inform stakeholder discussions.
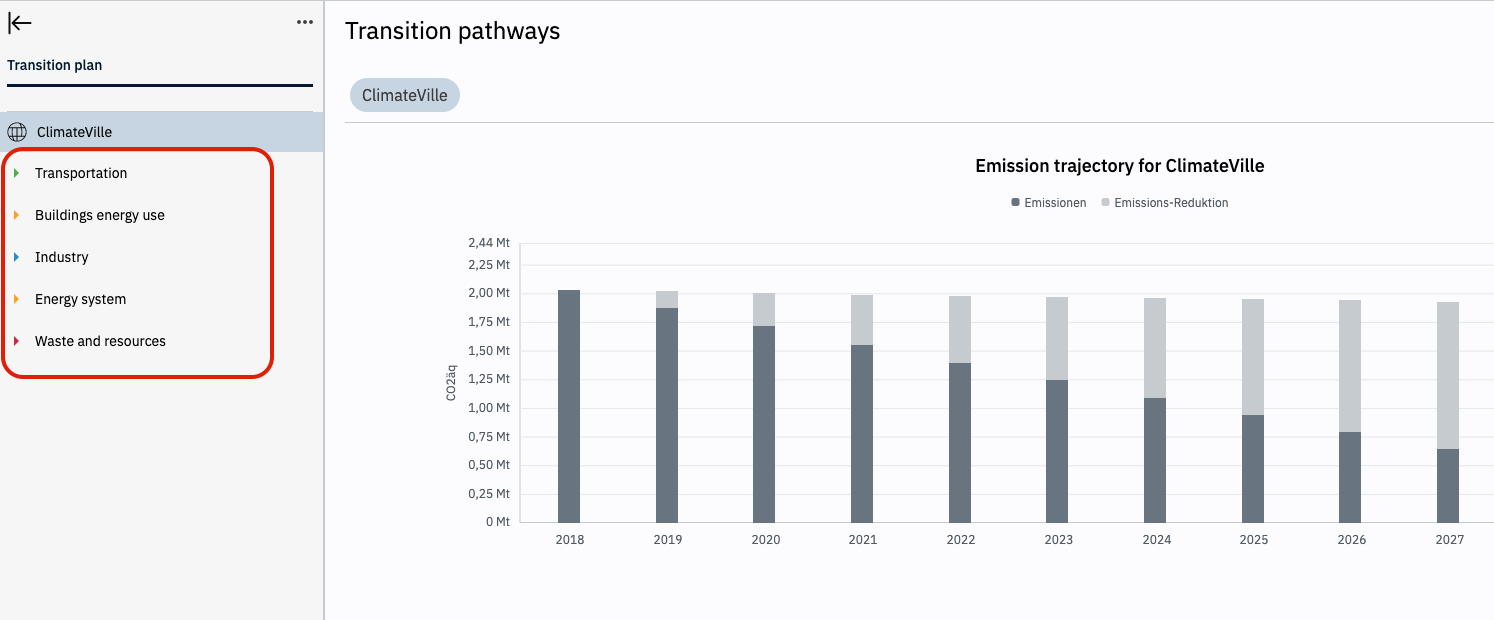
When you enter the feature, the first thing you see is the combined trajectory for you whole municipality.

Via the tree menu on the left side of the screen, you can dive deeper in each of the sectors, sub-sectors, Transition element groupings and Transition elements you mapped out in your Transition hierarchy. By doing so, you can see an increasingly granular emission trajectory.

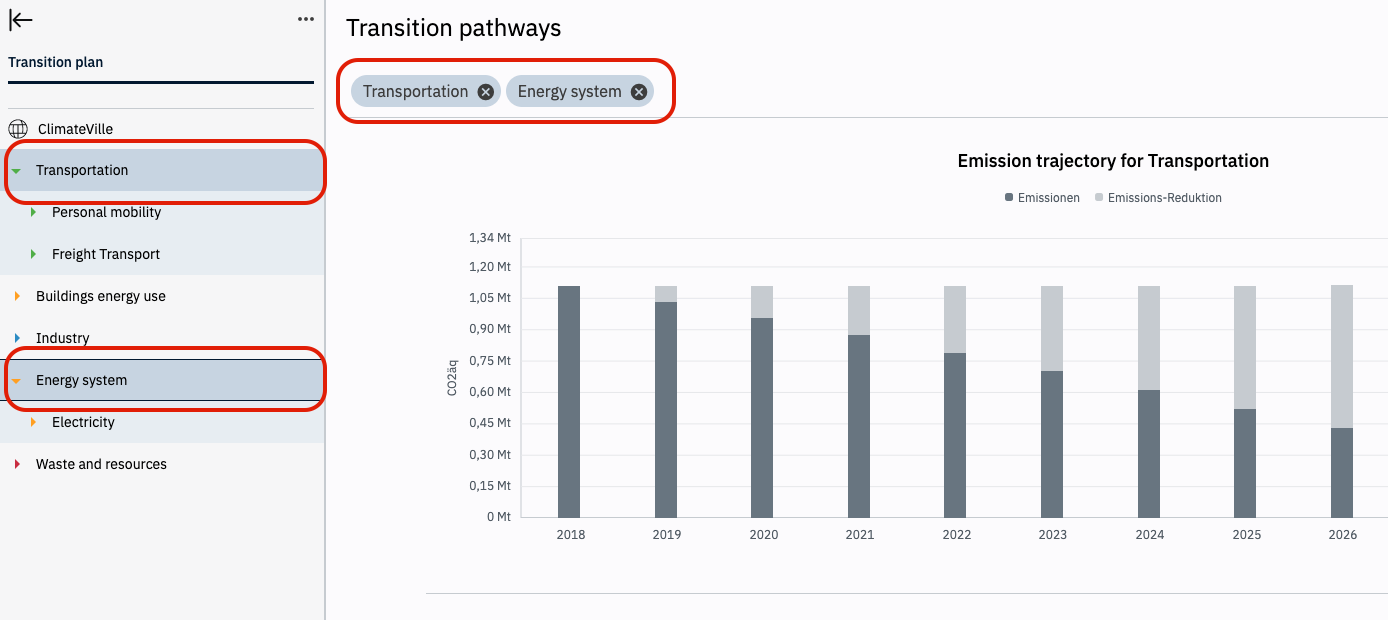
You are also able to compare different trajectories with each other by holding the "Ctrl" key (Mac users: "Cmd") and clicking on the sectors, sub-sectors, Transition element groupings and Transition elements you want to compare. You can also compare sectors with sub-sectors or other groupings.
You can see which sectors and sub-sectors you're comparing by looking below the headline "Emission pathways" or by looking at the greyed-out entries in the tree menu on the left side.

