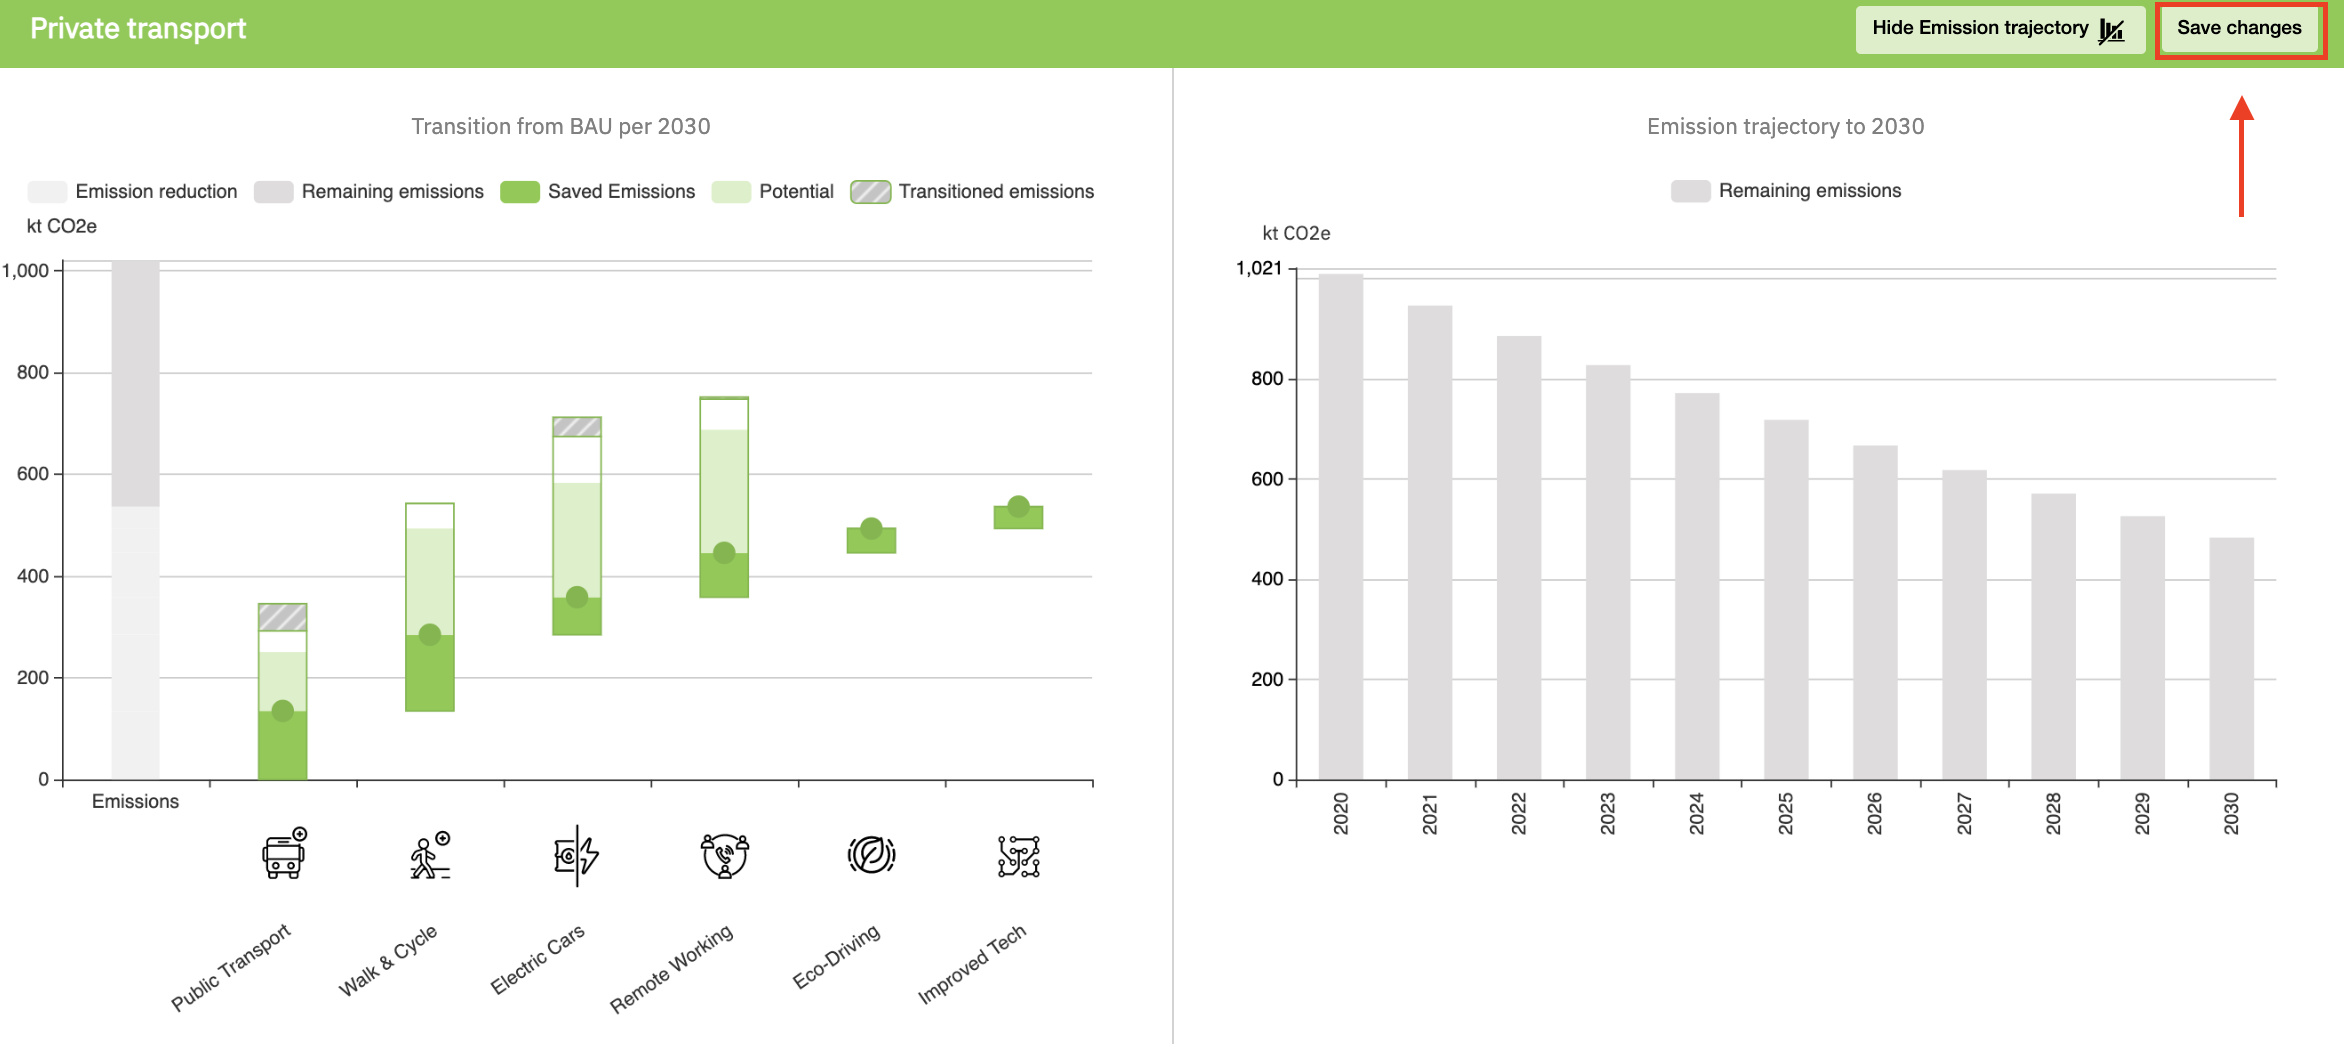
This article explains the concept of target balancing and how to work with it.
Contents
Navigating through target balancing
Interdependencies of Transition elements
Defining Target balancing
The ClimateBoard has a dedicated feature tab, Balance, which allows you to dynamically adjust the potential emissions reduction of a sector group, e.g. Transport.

This differs from the individual adjustments you make for Targets in the editor. Target balancing takes into account the interdependencies between different Transition elements. Together with the emissions trajectory, it shows you the accumulated emission results based on the chosen target values until your goal year.
Navigating through target balancing
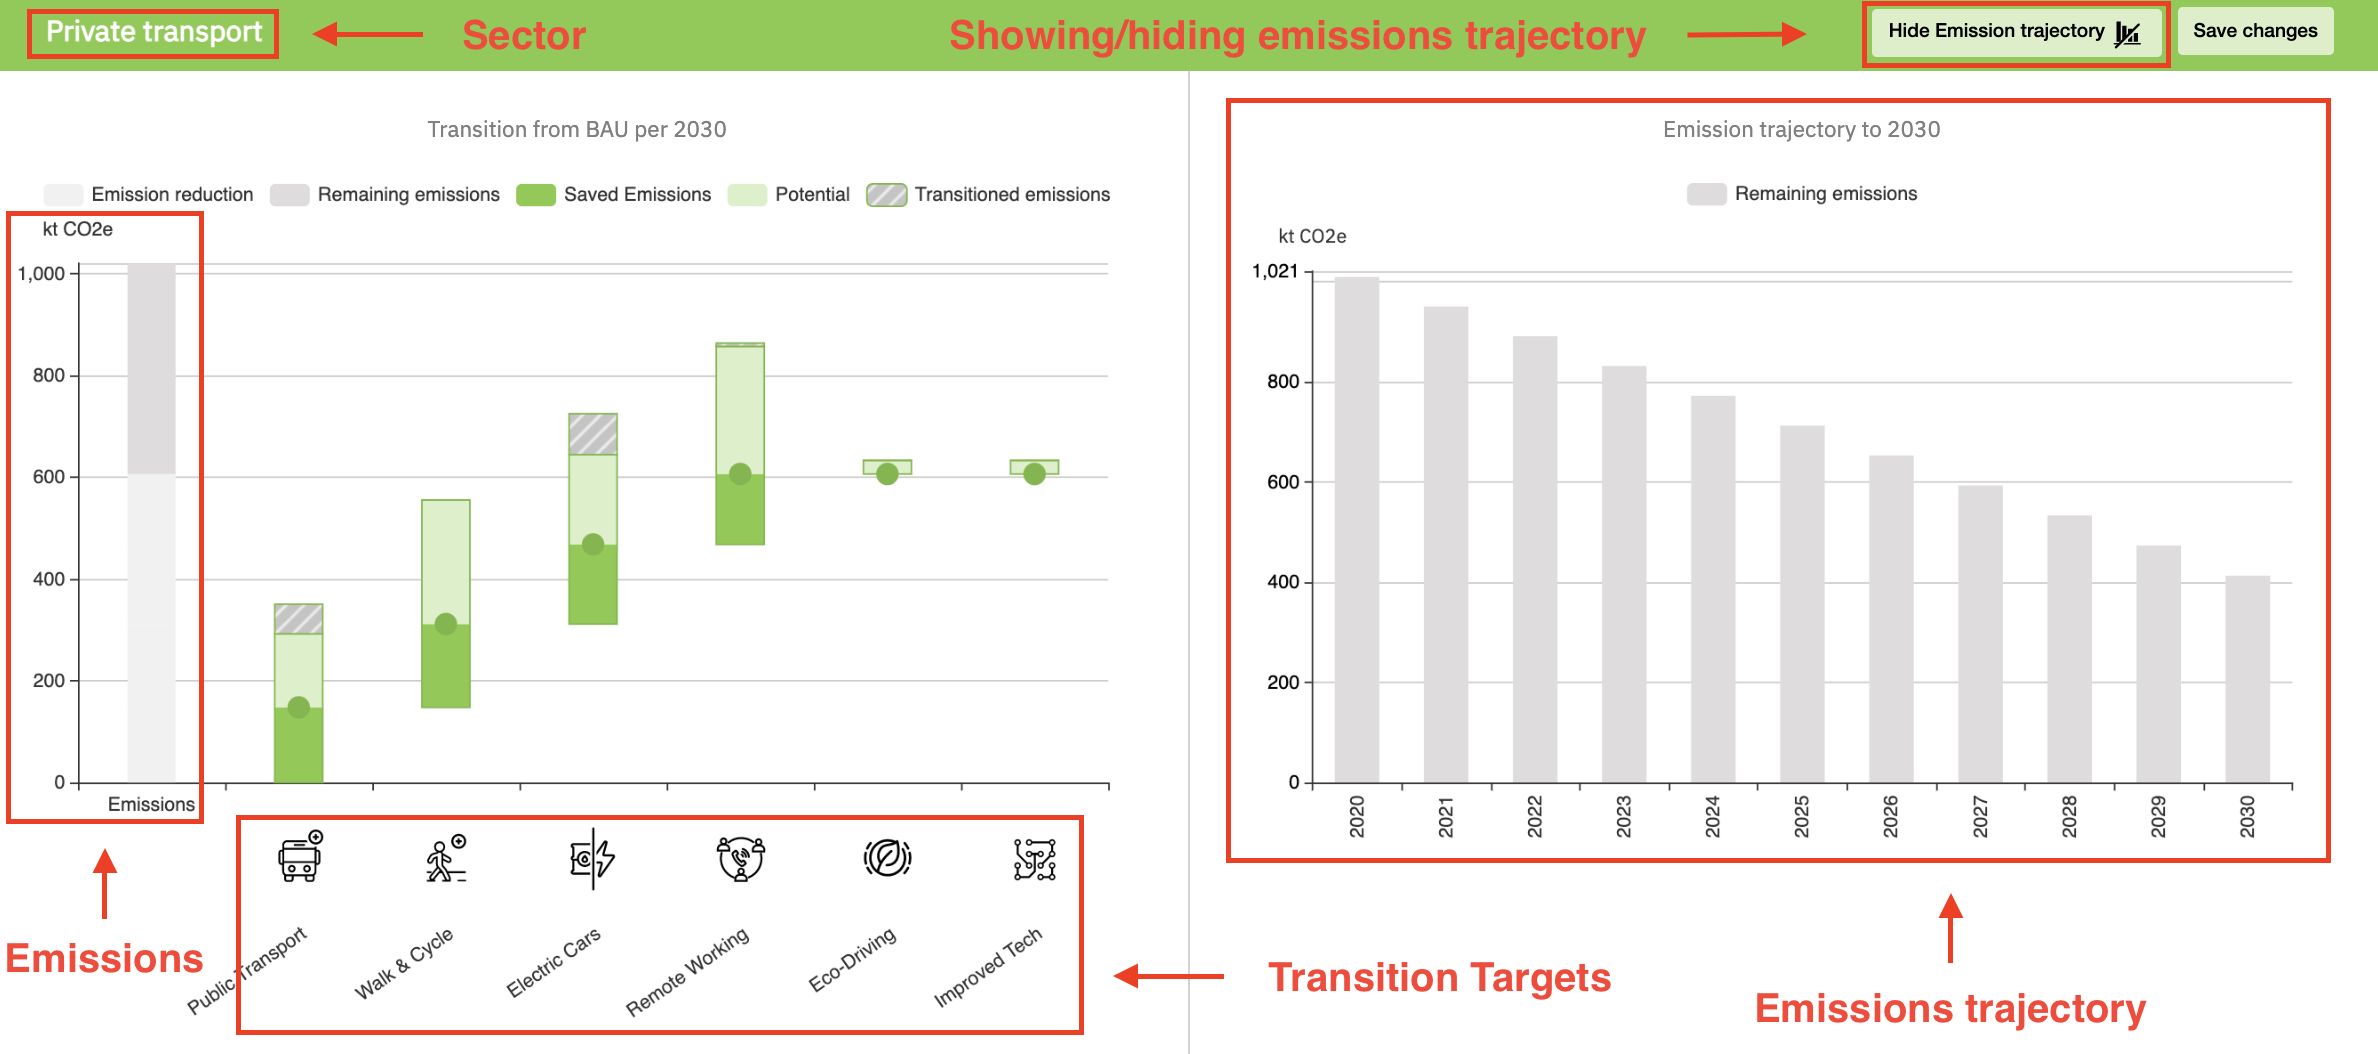
You will see the Balance tab has the Transition elements grouped by sector, as you scroll down the page.
On the left-hand side you will see an interactive target balancing graph, showing the amount of emissions in CO2e for that sector/grouping, and along the x-axis, the Transition elements.
On the right-hand side, you can choose to see your emissions trajectory by year, from start date to that of your goal. The remaining annual emissions are shown for that sector. This is linked to whatever changes you make on the left-hand side in the Target Balancing, or individually in the Transition elements in the editor. The emissions trajectory view can be switched on and off by clicking the icon. Switching it off enlarges the balancing view, which is useful when you have many targets in a particular grouping.
Operating target balancing
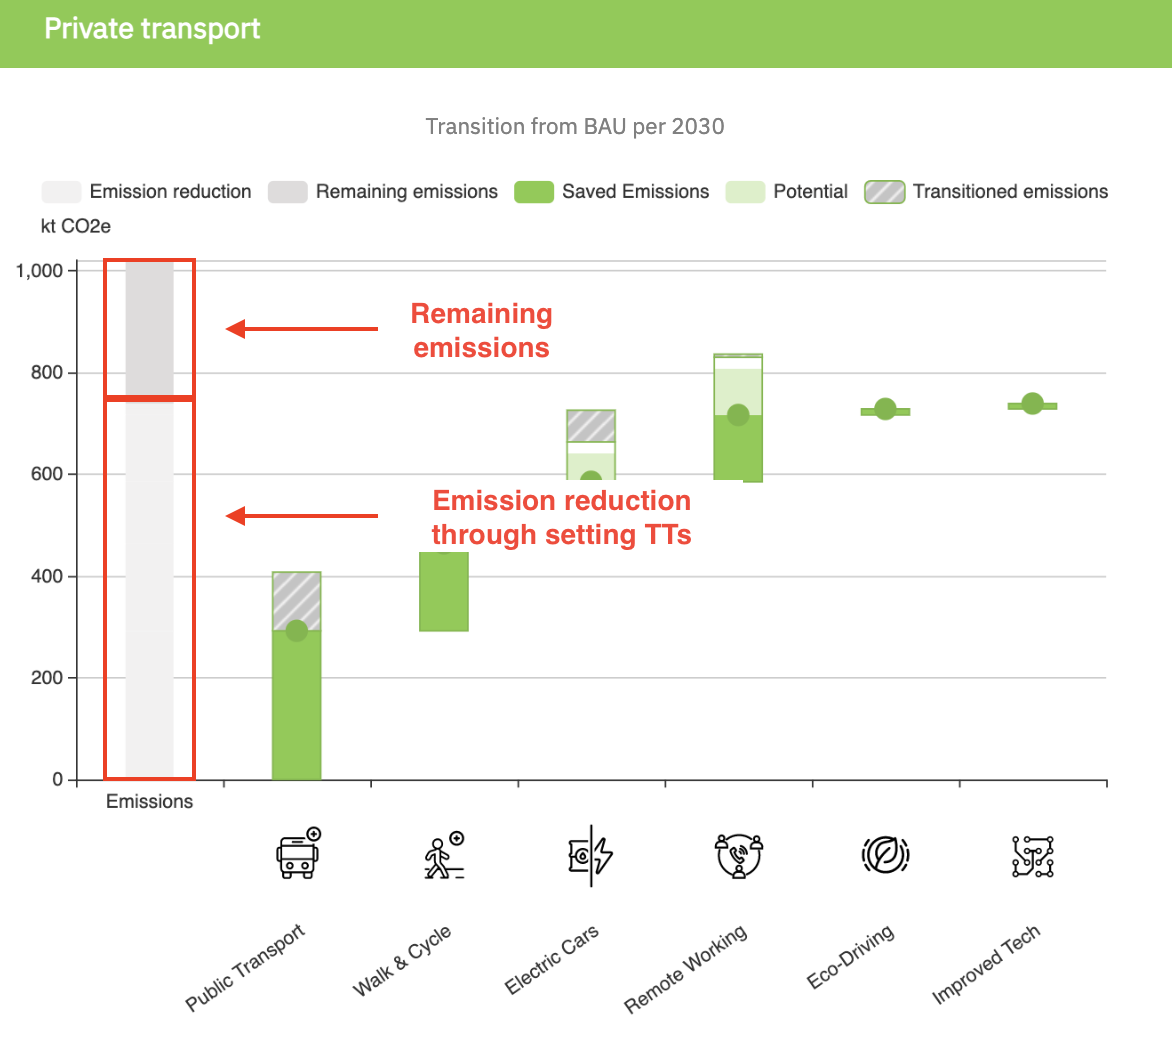
On the left-hand side of the graph is a bar chart of emissions showing the split between what your reference future inventory (remaining emissions) and what you are currently reducing in that sector with the shifts you have set in your Transition elements (emissions reduction).
Next to this, along the x-axis, each of the Transition elements will have a green circle, your lever, which denotes the current level of emissions reduction potential your Target is set at. You can simply move the levers up and down to change your target value for each Transition element.
Please note, if you have already edited a trajectory, so that it is not simply a linear progression, when you adjust the Target goal in the balance tab, the form of your trajectory will be maintained.
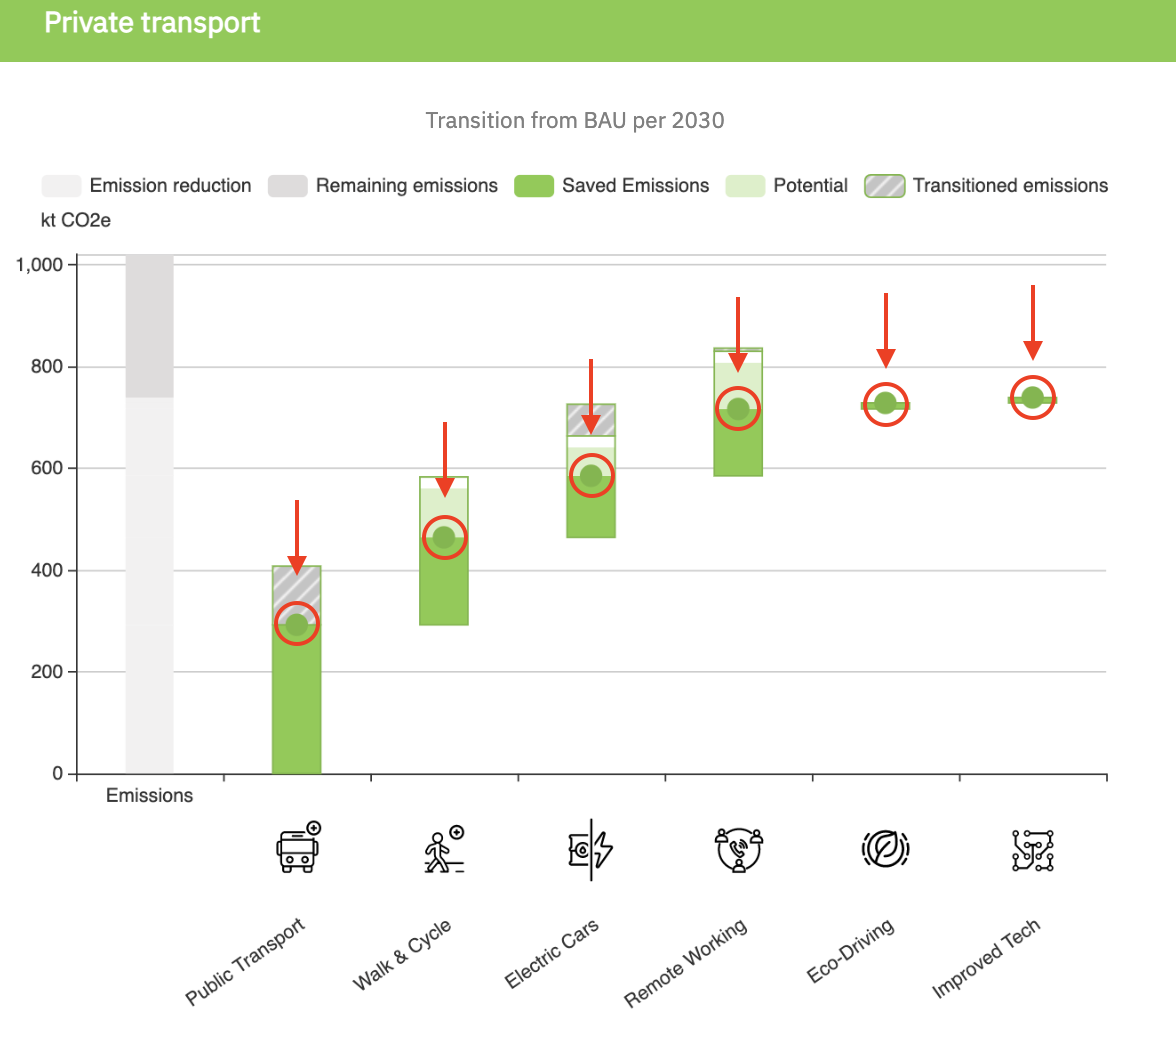
The emissions that will be saved by your Transition element, as currently set, are displayed as green (saved emissions). The potential not yet used, is shown as light green.
Interdependencies of Transition elements
Constrained Potential
By adjusting Transition elements that represent a shift in resource, shift in mechanism or general reduction (for example increased proportion of public transport, increased proportion of walking & cycling, shift to electric cars and remote working), you will notice, that the potential (light green bar) for other Transition elements decreases. This is displayed by a general reduction of the complete bar. For example, increasing the target value for remote working decreases the potential for electric cars, improved technology and eco-driving (for ICE cars) as fewer people will use those modes of travel for commuting.
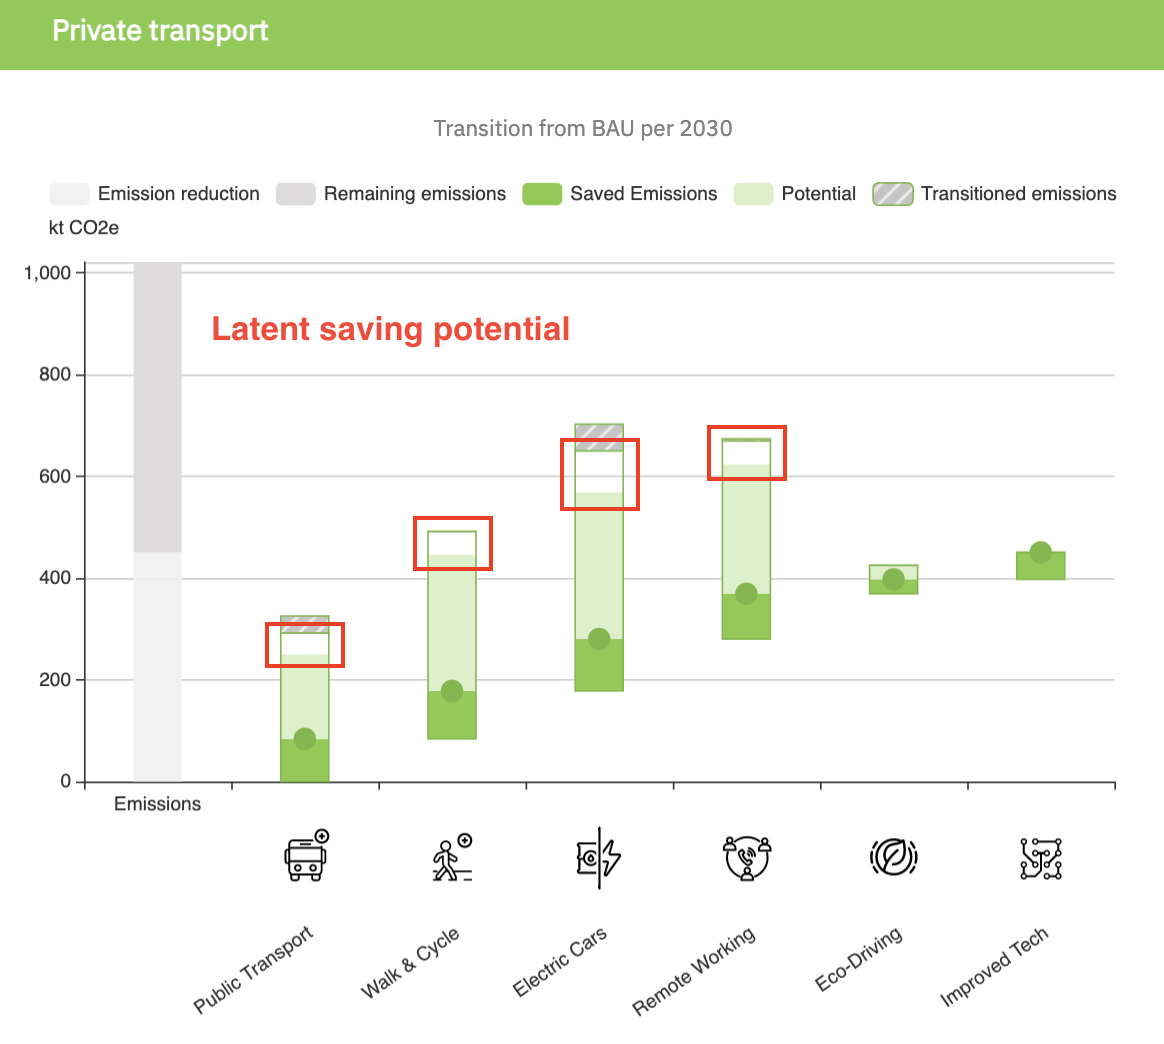
Latent saving potential
Implementing improvements to the efficiency of a current operation for your activity (with the same resource and mechanism, for example improved tech for ICE cars) will reduce the emissions it creates, and therefore the amount that is shown as being needed to reduce through Transition elements representing other shifts. As you implement those other shifts, such as to a new mechanism (i.e. from ICE to Electric vehicles), you will lose the impact of the efficiency improvements for the number of journeys you have replaced with the new mechanism, as, at this point more of our activity is now being carried out in a different way.
This is illustrated in our balancing graphic through a transparent section displaying in the bars for the Transition elements that represent shifting the mechanism of operation, reducing the operation needed or shifting the resource used.
As you increase these other Transition element types (i. e. electric cars), you will see the transparent section of the bar decreases. This happens, because you are reducing the amount of original operations which the efficiency can apply to (improved tech for ICE cars), and therefore save emissions from. In that sense, you override the impact of the efficiency-based Transition elements with these shifts as over time those should receive a lower priority in the transition due to total emissions reduction potential.
Transitioned emissions
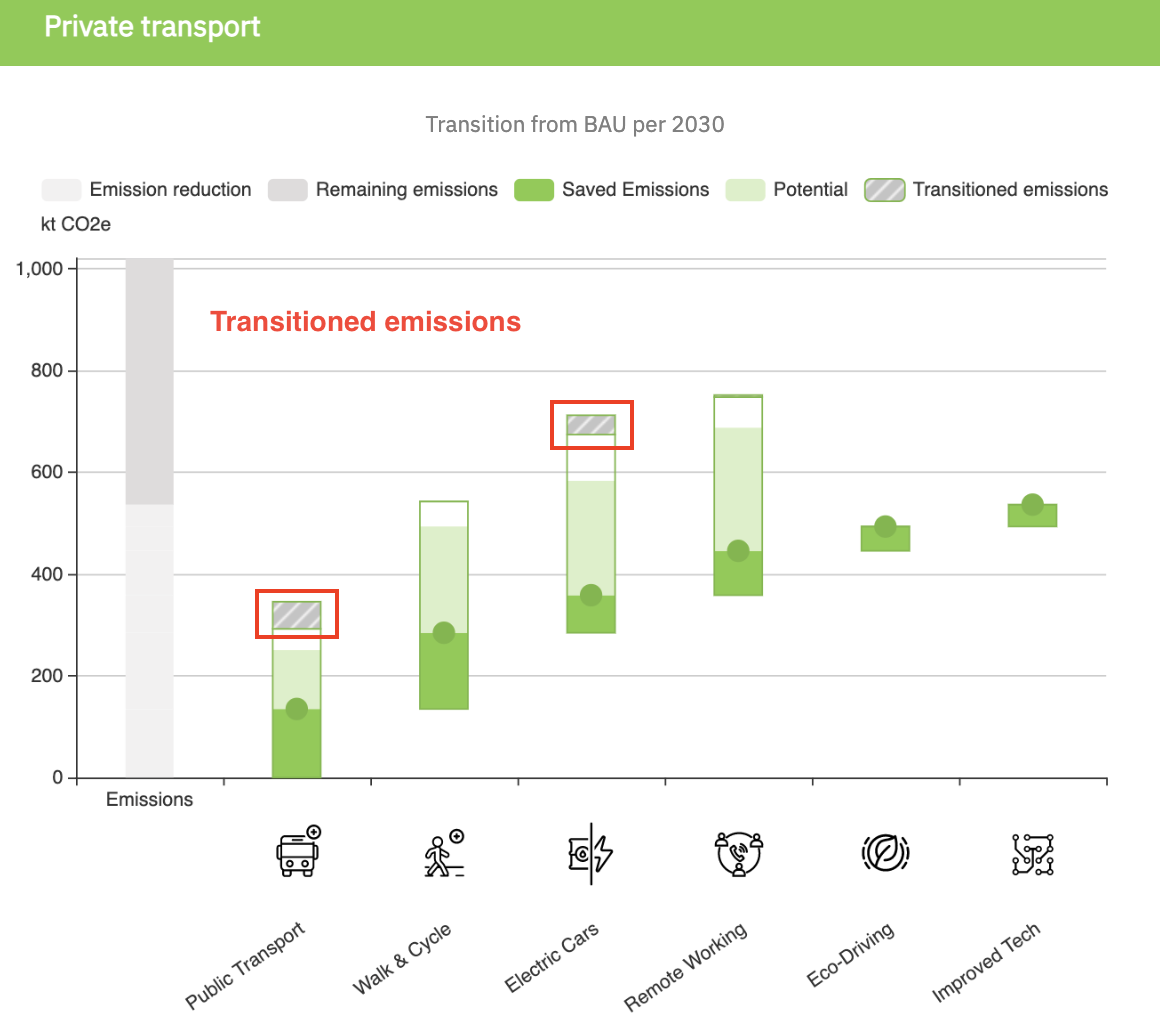
For most of the Transition elements, you will notice, that by increasing the saved emissions (green bar), a striped grey bar will appear. This bar displays the transitioned emissions, meaning the emissions that remain because they are produced by the activity you are shifting to as well as the resources used. As an example, shifting to driving electric vehicles will still have emissions from electricity use until the grid or source is fully decarbonised.
Saving changes
Once you have made all the changes you wanted to, you can find the Save changes button next to the emission trajectory button. This allows you to save the changes you have made, and these changes will appear in your editor view and drilldown, which means you can go in and play with targets, with stakeholders and not have to fear undoing your work so far.
