
This article gives you an overview of how the Transition hierarchy & Transition summary sections work together to allow you to easily edit, track and visualize your transition to net-zero.
Content
Overview
Found under Pathways, the Transition hierarchy & Transition summary sections provide you with a clear outline of your transition to net-zero in ClimateOS, based on the inputs you have made in other sections of the platform.
- Hierarchy: This section lets you create the structure for your transition in ClimateOS. It will be reflected across others found in the platform (Transition Elements, Target balance, Transition Pathways, Transition Summary and Actions).
- Summary: This section provides an in-depth view of how the transition elements you have chosen in the Transition hierarchy impact your target year emissions. The emissions data you have entered in the Inventory provide the baseline for the backend calculations done by our model across each of the transition elements.
*Please see this article for more information on how transition elements work with the emissions data.
First, let us review the components necessary to structure your transition in ClimateOS, all of which you can edit in the Transition hierarchy section of your account.

- Sector: In order to address the different socio-economic activities within your transition, they can be broken down by sectors. Some of the sectors you will find in the platform are listed below:
- Transportation
- Buildings energy use
- Industry
- Energy system
- Waste and resources
- Sub-sector: To make the transition per sector more manageable, you can add and create sub-sectors.
- An example would be the Personal Transport sub-sector found under the Transportation sector.
- Transition Element: Refers to the shift in activity from a high carbon state to a low carbon one. *Please see this article for more information on Transition Elements.
- Based on your transition you can have several transition elements per sector or sub-sector. As such, you can have different transition element categories. You can see how this works by scrolling to the Transition hierarchy portion of this article.
These components work together to provide a clear path to reaching your target year emissions (Fig. 1).
Fig. 1

Secondly, the structure you create in the Transition hierarchy is an essential part of your journey on the ClimateOS platform (Fig. 2). As mentioned above, the work between different sections of ClimateOS is what populates the Transition summary.
Fig. 2

Transition hierarchy
The Transition hierarchy is where you create the structure for your climate transition in ClimateOS. A place for you to easily add, and if needed, edit the components of your transition (sector, sub-sector and transition element). Gain a visual understanding of the shifts being leveraged in your climate action plan, while keeping you and your team on the same page about internal priorities, next steps, and reporting.
Get started
- This section is organized in the form of a tree diagram.
- The structure you create in this section will be reflected throughout your entire transition planning process in the platform (Transition Elements, Target balance, Transition Pathways, Transition Summary and Actions).
- Choosing a sector relevant to your transition based on the activities you want to shift to low-carbon provides the starting point in your structure. Think of it as the main branch in your tree diagram. In a second step, you can add sub-sectors and transition elements to it. (Fig.3)
Fig. 3

Adding, editing, moving and removing groups in the Transition hierarchy
As you structure your transition across sectors, you can add groups. Group refers to each sub-level you add to your tree diagram i.e. a sector, a sub-sector and a transition element category.
Transition element categories can be used in the tree diagram to classify transition elements under a sector or sub-sector. In the figure below, you can see an example in which the transition elements under the sub-sector “Personal transport” have been divided into two different categories: “Modal shift” and “Reducing impact of cars”. (Fig. 4)
Fig. 4

To showcase various perspectives on the way you approach your transition, the tree diagram can be structured in different ways (Fig. 5) The only constant is that transition elements have to always be associated with at least one sector. This is because as mentioned in the overview portion of this article, transition elements refer to the shifts in activity from high carbon states to low carbon ones.
Fig. 5

The tree diagram is completely customizable, you can add a group [sub-level], rename any sub-level, change the color of a sector, move any sub-level within the tree diagram and remove any sub-level from your Transition hierarchy. This can be done by clicking on the buttons on the top Transition hierarchy navigation bar or by clicking on the “...” button on each sub-level. (Fig. 6)
Fig. 6
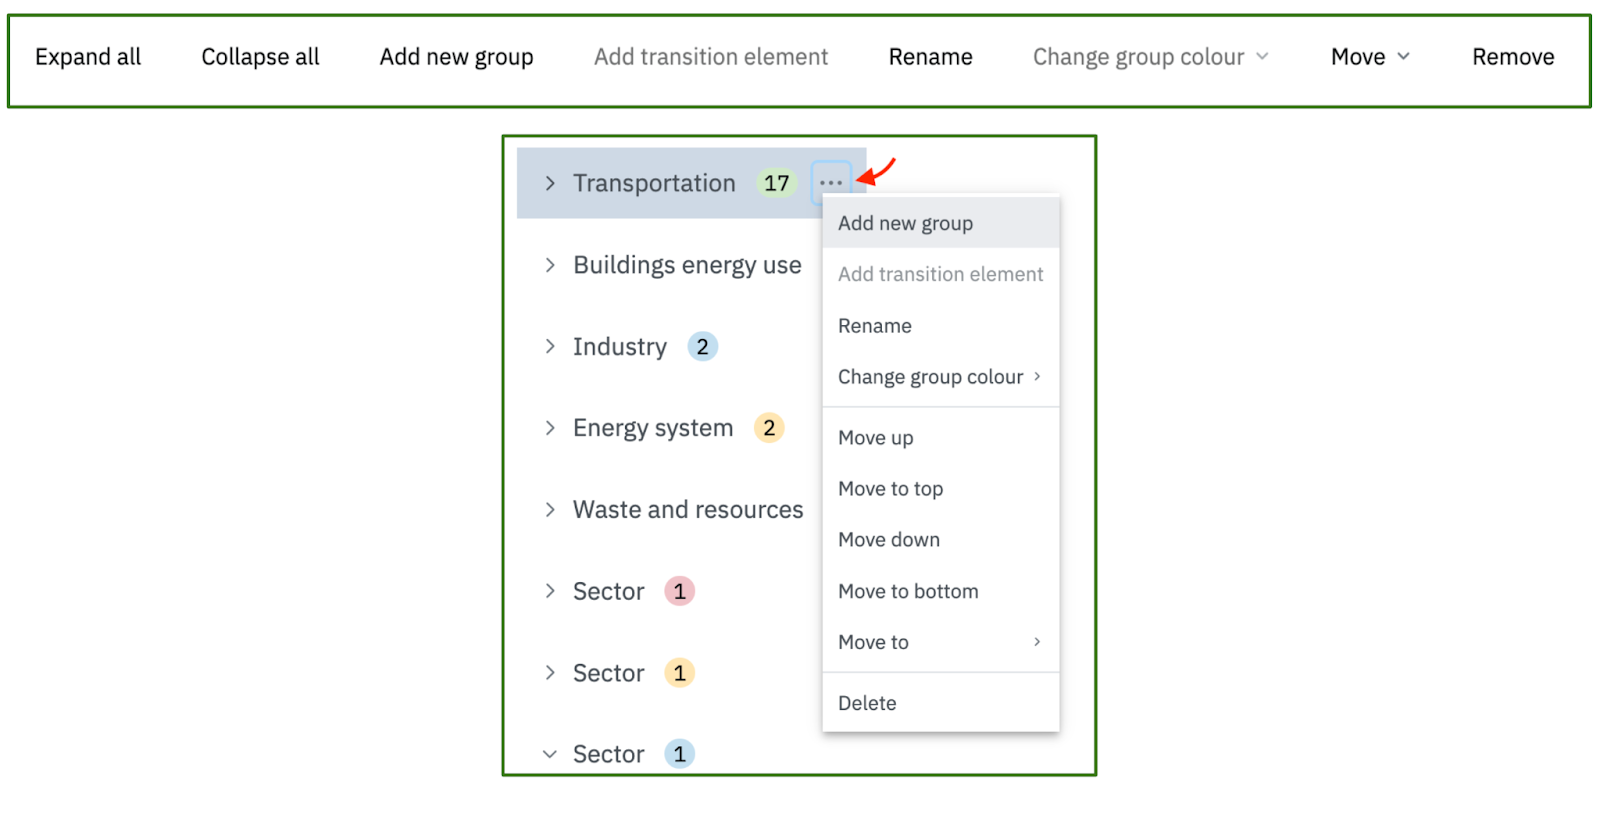
- To add a sector, sub-sector and/or a transition element category click on the “Add new group” button. To add a transition element click on the “Add transition element” button.
- To rename a sector, sub-sector or transition element category click on the “Rename” button. Transition elements cannot be renamed as they are created by ClimateView and are prefixed in ClimateOS.
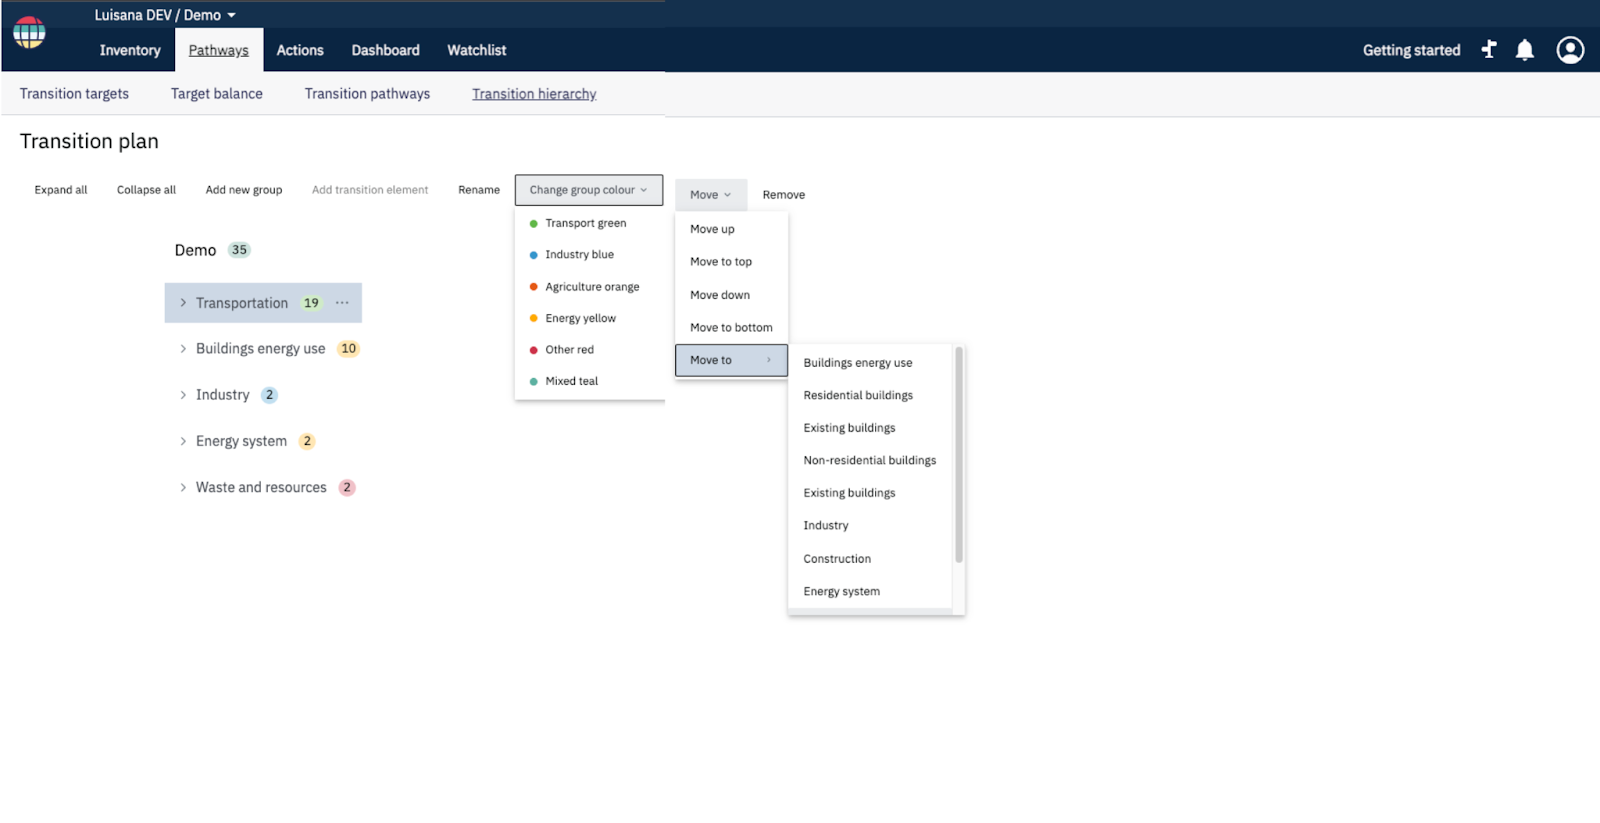
- To change the color of a sector click on the “Change group color” button. Colors can only be changed by sector. When you change the color of a sector, it will change the color of all the sub-levels within it. You can see this in the figure below, the “Transportation” sector is green meaning everything listed under it will also be green. (Fig. 7)
- To move a sub-level within the tree diagram click on the “Move” button and choose the direction, sector or sub-sector where you would like to move the sub-level. (Fig. 7)
- To remove a sub-level within the tree diagram click on the “Remove” button.
*Sub-level refers to any part of the tree diagram: sector, sub-sector, transition element category and transition element.
Fig. 7
Transition elements per sector or sub-sector
Transition elements refer to the different shifts that collectively comprise your transition in a given sector. To add them to your tree diagram, click on the “Add transition element” button found on the top navigation bar of the Transition hierarchy. (Fig. 8) All the transition elements available in ClimateOS will then be displayed by sector. You can click on the relevant sector and then choose the transition elements relevant to your transition. (Fig. 9)
Remember, you cannot associate a single transition element with multiple sectors and sub-sectors, as this would result in double counting your carbon abatement efforts. Every operation can only be shifted once and therefore we cannot shift operations for more than one sector or sub-sector.
Fig. 8

Fig. 9

Transition summary
The Transition summary provides you with an overview of how the transition elements you have chosen in the Transition hierarchy impact your target year emissions, compared to the Business-As-Usual (BAU) scenario.
Get started
-
You will not see the emissions data you have entered in the Inventory here, instead, the data displayed is:
-
Your target year Business-as-usual (BAU) emissions per sector i.e. the emissions in your target year without transition elements.
-
Your target year carbon abatement by sector based on the selected transition elements. (Fig.10)
-
This section is not editable, as the structure and values are pulled from the inputs you have entered across ClimateOS, including in the Inventory, Transition elements and Transition hierarchy.
Fig. 10

As mentioned in the Transition hierarchy portion of this article, the tree diagram you set there is used across other sections of ClimateOS. This is true for the Transition summary where you can dive into each sector and see the impact of your chosen transition elements on your target year emissions. (Fig. 11 & Fig. 12)
Fig. 11

Fig. 12

FAQs
Where is my old hierarchy?
If you were a ClimateOS user before the release of the new Transition hierarchy & Transition summary, then all of your old hierarchy data has been automatically moved to these new sections. You do not have to do anything on your end.
What are the advantages of the new hierarchy?
It improves upon the usability and visualization of the old hierarchy. Additionally, it provides parity across the platform with the same tree diagram used in the Transition hierarchy now being used in other sections of ClimateOS (Transition Elements, Target balance, Transition Pathways, Transition Summary and Actions).
Do I need to update anything after the migration?
No, if you have any specific questions, please feel free to reach out to support@climateview.global.
Can I input top-down emissions?
No, all inputs will be calculated bottom-up. For more information on bottom-up calculations, please see this article.